Quick Start
Before proceeding, please ensure you have installed GreptimeDB.
This guide will walk you through creating a metric table and a log table, highlighting the core features of GreptimeDB.
You’ll learn (10–15 minutes)
- Start and connect to GreptimeDB locally
- Create metrics and logs tables and insert sample data
- Query and aggregate data
- Compute p95 and ERROR counts in 5-second windows and align them
- Join metrics with logs to spot anomalous hosts and time periods
- Combine SQL and PromQL to query data
Connect to GreptimeDB
GreptimeDB supports multiple protocols for interacting with the database. In this quick start document, we use SQL for simplicity.
If your GreptimeDB instance is running on 127.0.0.1 with the MySQL client default port 4002 or the PostgreSQL client default port 4003,
you can connect to GreptimeDB using the following commands.
By default, GreptimeDB does not have authentication enabled. You can connect to the database without providing a username and password in this section.
mysql -h 127.0.0.1 -P 4002
Or
psql -h 127.0.0.1 -p 4003 -d public
You can also use your browser to access the built-in DB dashboard at http://127.0.0.1:4000/dashboard to run the SQL queries in this document.
Create tables
Suppose you have an event table named grpc_latencies that stores the gRPC services and processing latencies of your application.
The table schema is as follows:
-- Metrics: gRPC call latency in milliseconds
CREATE TABLE grpc_latencies (
  ts TIMESTAMP TIME INDEX,
  host STRING INVERTED INDEX,
  method_name STRING,
  latency DOUBLE,
  PRIMARY KEY (host, method_name)
);
ts: The timestamp when the metric was collected. It is the time index column.host: The hostname of the application server, enabling inverted index.method_name: The name of the RPC request method.latency: The latency of the RPC request.
Additionally, there is a table app_logs for storing application logs:
-- Logs: application logs
CREATE TABLE app_logs (
  ts TIMESTAMP TIME INDEX,
  host STRING INVERTED INDEX,
  api_path STRING,
  log_level STRING,
  log_msg STRING FULLTEXT INDEX WITH('case_sensitive' = 'false'),
  PRIMARY KEY (host, log_level)
) with('append_mode'='true');
ts: The timestamp of the log entry. It is the time index column.host: The hostname of the application server, enabling inverted index.api_path: The API path.log_level: The log level of the log entry.log_msg: The log message, enabling fulltext index.
And it's append only by setting append_mode to true, which is good for performance. Other table options, such as data retention, are supported too.
We use SQL to ingest the data below, so we need to create the tables manually. However, GreptimeDB is schemaless and can automatically generate schemas when using other ingestion methods.
Write data
Let's insert some mocked data to simulate collected metrics and error logs.
Two application servers, host1 and host2,
have been recording gRPC latencies. Starting from 2024-07-11 20:00:10,
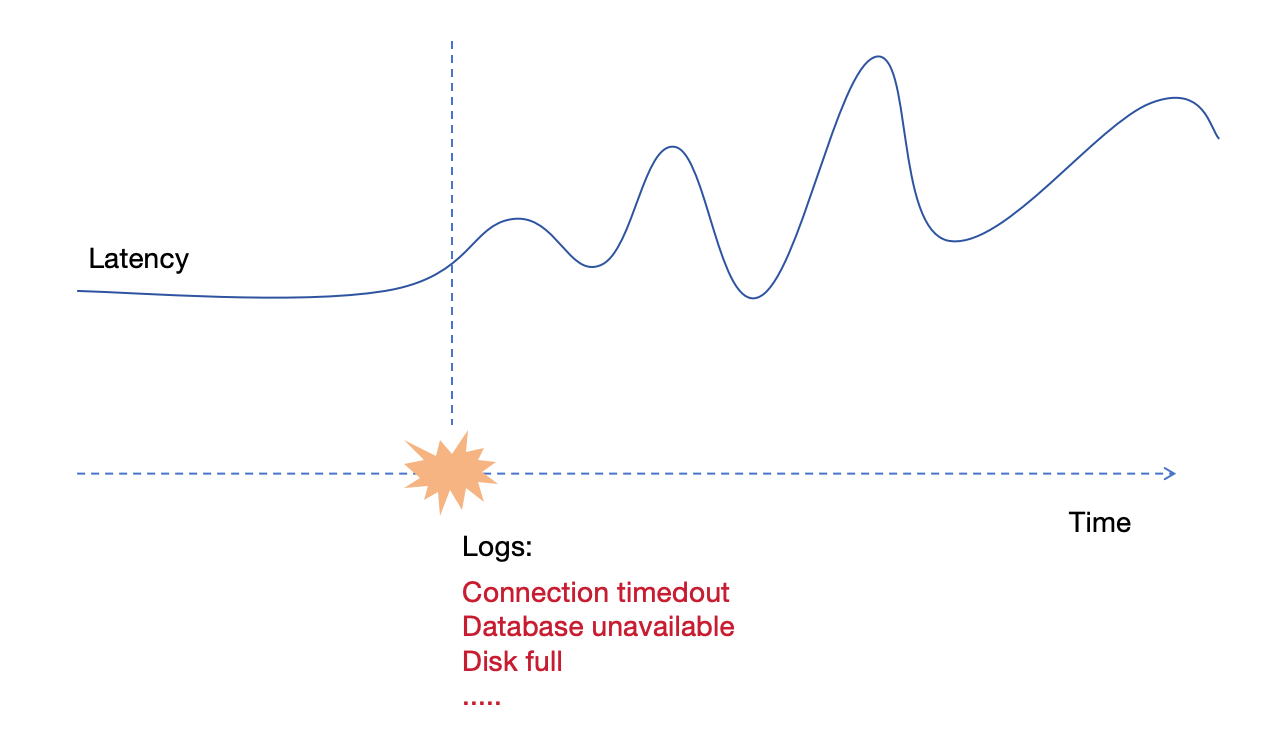
host1 experienced a significant increase in latency.
The following image shows the unstable latencies of host1.
The following SQL statements insert the mocked data.
Before 2024-07-11 20:00:10, the hosts were functioning normally:
INSERT INTO grpc_latencies (ts, host, method_name, latency) VALUES
  ('2024-07-11 20:00:06', 'host1', 'GetUser', 103.0),
  ('2024-07-11 20:00:06', 'host2', 'GetUser', 113.0),
  ('2024-07-11 20:00:07', 'host1', 'GetUser', 103.5),
  ('2024-07-11 20:00:07', 'host2', 'GetUser', 107.0),
  ('2024-07-11 20:00:08', 'host1', 'GetUser', 104.0),
  ('2024-07-11 20:00:08', 'host2', 'GetUser', 96.0),
  ('2024-07-11 20:00:09', 'host1', 'GetUser', 104.5),
  ('2024-07-11 20:00:09', 'host2', 'GetUser', 114.0);
After 2024-07-11 20:00:10, host1's latencies becomes unstable, fluctuating greatly with occasional spikes of several thousand milliseconds:
INSERT INTO grpc_latencies (ts, host, method_name, latency) VALUES
  ('2024-07-11 20:00:10', 'host1', 'GetUser', 150.0),
  ('2024-07-11 20:00:10', 'host2', 'GetUser', 110.0),
  ('2024-07-11 20:00:11', 'host1', 'GetUser', 200.0),
  ('2024-07-11 20:00:11', 'host2', 'GetUser', 102.0),
  ('2024-07-11 20:00:12', 'host1', 'GetUser', 1000.0),
  ('2024-07-11 20:00:12', 'host2', 'GetUser', 108.0),
  ('2024-07-11 20:00:13', 'host1', 'GetUser', 80.0),
  ('2024-07-11 20:00:13', 'host2', 'GetUser', 111.0),
  ('2024-07-11 20:00:14', 'host1', 'GetUser', 4200.0),
  ('2024-07-11 20:00:14', 'host2', 'GetUser', 95.0),
  ('2024-07-11 20:00:15', 'host1', 'GetUser', 90.0),
  ('2024-07-11 20:00:15', 'host2', 'GetUser', 115.0),
  ('2024-07-11 20:00:16', 'host1', 'GetUser', 3000.0),
  ('2024-07-11 20:00:16', 'host2', 'GetUser', 95.0),
  ('2024-07-11 20:00:17', 'host1', 'GetUser', 320.0),
  ('2024-07-11 20:00:17', 'host2', 'GetUser', 115.0),
  ('2024-07-11 20:00:18', 'host1', 'GetUser', 3500.0),
  ('2024-07-11 20:00:18', 'host2', 'GetUser', 95.0),
  ('2024-07-11 20:00:19', 'host1', 'GetUser', 100.0),
  ('2024-07-11 20:00:19', 'host2', 'GetUser', 115.0),
  ('2024-07-11 20:00:20', 'host1', 'GetUser', 2500.0),
  ('2024-07-11 20:00:20', 'host2', 'GetUser', 95.0);
Some error logs were collected when the host1 latencies of RPC requests encounter latency issues:
INSERT INTO app_logs (ts, host, api_path, log_level, log_msg) VALUES
  ('2024-07-11 20:00:10', 'host1', '/api/v1/resource', 'ERROR', 'Connection timeout'),
  ('2024-07-11 20:00:10', 'host1', '/api/v1/billings', 'ERROR', 'Connection timeout'),
  ('2024-07-11 20:00:11', 'host1', '/api/v1/resource', 'ERROR', 'Database unavailable'),
  ('2024-07-11 20:00:11', 'host1', '/api/v1/billings', 'ERROR', 'Database unavailable'),
  ('2024-07-11 20:00:12', 'host1', '/api/v1/resource', 'ERROR', 'Service overload'),
  ('2024-07-11 20:00:12', 'host1', '/api/v1/billings', 'ERROR', 'Service overload'),
  ('2024-07-11 20:00:13', 'host1', '/api/v1/resource', 'ERROR', 'Connection reset'),
  ('2024-07-11 20:00:13', 'host1', '/api/v1/billings', 'ERROR', 'Connection reset'),
  ('2024-07-11 20:00:14', 'host1', '/api/v1/resource', 'ERROR', 'Timeout'),
  ('2024-07-11 20:00:14', 'host1', '/api/v1/billings', 'ERROR', 'Timeout'),
  ('2024-07-11 20:00:15', 'host1', '/api/v1/resource', 'ERROR', 'Disk full'),
  ('2024-07-11 20:00:15', 'host1', '/api/v1/billings', 'ERROR', 'Disk full'),
  ('2024-07-11 20:00:16', 'host1', '/api/v1/resource', 'ERROR', 'Network issue'),
  ('2024-07-11 20:00:16', 'host1', '/api/v1/billings', 'ERROR', 'Network issue');
Query data
Filter by tags and time index
You can filter data using the WHERE clause.
For example, to query the latency of host1 after 2024-07-11 20:00:15:
SELECT *
  FROM grpc_latencies
  WHERE host = 'host1' AND ts > '2024-07-11 20:00:15';
+---------------------+-------+-------------+---------+
| ts                  | host  | method_name | latency |
+---------------------+-------+-------------+---------+
| 2024-07-11 20:00:16 | host1 | GetUser     |    3000 |
| 2024-07-11 20:00:17 | host1 | GetUser     |     320 |
| 2024-07-11 20:00:18 | host1 | GetUser     |    3500 |
| 2024-07-11 20:00:19 | host1 | GetUser     |     100 |
| 2024-07-11 20:00:20 | host1 | GetUser     |    2500 |
+---------------------+-------+-------------+---------+
5 rows in set (0.14 sec)
You can also use functions when filtering the data.
For example, you can use approx_percentile_cont to calculate the 95th percentile of the latency grouped by the host:
SELECT
  approx_percentile_cont(0.95) WITHIN GROUP (ORDER BY latency) AS p95_latency,
  host
FROM grpc_latencies
WHERE ts >= '2024-07-11 20:00:10'
GROUP BY host;
+-------------------+-------+
| p95_latency       | host  |
+-------------------+-------+
| 4164.999999999999 | host1 |
|               115 | host2 |
+-------------------+-------+
2 rows in set (0.11 sec)
Search logs by keyword
Filter the log messages by keyword timeout:
SELECT
  *
FROM
  app_logs
WHERE
  lower(log_msg) @@ 'timeout'
  AND ts > '2024-07-11 20:00:00'
ORDER BY
  ts;
+---------------------+-------+------------------+-----------+--------------------+
| ts                  | host  | api_path         | log_level | log_msg            |
+---------------------+-------+------------------+-----------+--------------------+
| 2024-07-11 20:00:10 | host1 | /api/v1/billings | ERROR     | Connection timeout |
| 2024-07-11 20:00:10 | host1 | /api/v1/resource | ERROR     | Connection timeout |
| 2024-07-11 20:00:14 | host1 | /api/v1/billings | ERROR     | Timeout            |
| 2024-07-11 20:00:14 | host1 | /api/v1/resource | ERROR     | Timeout            |
+---------------------+-------+------------------+-----------+--------------------+
The @@ operator is used for term searching.
Range query
You can use range queries to monitor latencies in real-time. For example, to calculate the p95 latency of requests using a 5-second window:
SELECT
  ts,
  host,
  approx_percentile_cont(0.95) WITHIN GROUP (ORDER BY latency)
    RANGE '5s' AS p95_latency
FROM
  grpc_latencies
ALIGN '5s' FILL PREV
ORDER BY
  host,ts;
+---------------------+-------+-------------+
| ts                  | host  | p95_latency |
+---------------------+-------+-------------+
| 2024-07-11 20:00:05 | host1 |       104.5 |
| 2024-07-11 20:00:10 | host1 |        4200 |
| 2024-07-11 20:00:15 | host1 |        3500 |
| 2024-07-11 20:00:20 | host1 |        2500 |
| 2024-07-11 20:00:05 | host2 |         114 |
| 2024-07-11 20:00:10 | host2 |         111 |
| 2024-07-11 20:00:15 | host2 |         115 |
| 2024-07-11 20:00:20 | host2 |          95 |
+---------------------+-------+-------------+
8 rows in set (0.06 sec)
The range query is very powerful for querying and aggregating data based on time windows, please read the manual to learn more.
Correlate Metrics and Logs
By combining the data from the two tables,
you can easily and quickly determine the time of failure and the corresponding logs.
The following SQL query uses the JOIN operation to correlate the metrics and logs:
-- Align metrics and logs into 5s buckets, then join
WITH
  -- metrics: per-host p95 latency in 5s buckets
  metrics AS (
    SELECT
      ts,
      host,
      approx_percentile_cont(0.95) WITHIN GROUP (ORDER BY latency) RANGE '5s' AS p95_latency
    FROM grpc_latencies
    ALIGN '5s' FILL PREV
  ),
  -- logs: per-host ERROR counts in the same 5s buckets
  logs AS (
    SELECT
      ts,
      host,
      count(log_msg) RANGE '5s' AS num_errors
    FROM app_logs
    WHERE log_level = 'ERROR'
    ALIGN '5s'
  )
SELECT
  m.ts,
  m.p95_latency,
  COALESCE(l.num_errors, 0) AS num_errors,
  m.host
FROM metrics m
LEFT JOIN logs l
  ON m.host = l.host AND m.ts = l.ts
ORDER BY m.ts, m.host;
+---------------------+-------------+------------+-------+
| ts                  | p95_latency | num_errors | host  |
+---------------------+-------------+------------+-------+
| 2024-07-11 20:00:05 |       104.5 |          0 | host1 |
| 2024-07-11 20:00:05 |         114 |          0 | host2 |
| 2024-07-11 20:00:10 |        4200 |         10 | host1 |
| 2024-07-11 20:00:10 |         111 |          0 | host2 |
| 2024-07-11 20:00:15 |        3500 |          4 | host1 |
| 2024-07-11 20:00:15 |         115 |          0 | host2 |
| 2024-07-11 20:00:20 |        2500 |          0 | host1 |
| 2024-07-11 20:00:20 |          95 |          0 | host2 |
+---------------------+-------------+------------+-------+
8 rows in set (0.02 sec)
We can see that during the time window when the gRPC latencies increases, the number of error logs also increases significantly, and we've identified that the problem is on host1.
Query data via PromQL
GreptimeDB supports Prometheus Query Language and its APIs, allowing you to query metrics using PromQL. For example, you can retrieve the p95 latency over the last 1 minute per host with this query:
quantile_over_time(0.95, grpc_latencies{host!=""}[1m])
To test this, use the following curl command:
curl -X POST \
  -H 'Authorization: Basic {{authorization if exists}}' \
  --data-urlencode 'query=quantile_over_time(0.95, grpc_latencies{host!=""}[1m])' \
  --data-urlencode 'start=2024-07-11 20:00:00Z' \
  --data-urlencode 'end=2024-07-11 20:00:20Z' \
  --data-urlencode 'step=1m' \
  'http://localhost:4000/v1/prometheus/api/v1/query_range'
We set the step to 1 minute.
Output:
{
  "status": "success",
  "data": {
    "resultType": "matrix",
    "result": [
      {
        "metric": {
          "__name__": "grpc_latencies",
          "host": "host1",
          "method_name": "GetUser"
        },
        "values": [
          [
            1720728000.0,
            "103"
          ]
        ]
      },
      {
        "metric": {
          "__name__": "grpc_latencies",
          "host": "host2",
          "method_name": "GetUser"
        },
        "values": [
          [
            1720728000.0,
            "113"
          ]
        ]
      }
    ]
  }
}
Even more powerful, you can use SQL to execute PromQL and mix the two, for example:
TQL EVAL ('2024-07-11 20:00:00Z', '2024-07-11 20:00:20Z','1m')
    quantile_over_time(0.95, grpc_latencies{host!=""}[1m]);
This SQL query will produce:
+---------------------+---------------------------------------------------------+-------+-------------+
| ts                  | prom_quantile_over_time(ts_range,latency,Float64(0.95)) | host  | method_name |
+---------------------+---------------------------------------------------------+-------+-------------+
| 2024-07-11 20:00:00 |                                                     113 | host2 | GetUser     |
| 2024-07-11 20:00:00 |                                                     103 | host1 | GetUser     |
+---------------------+---------------------------------------------------------+-------+-------------+
Rewrite the correlation example:
WITH
  metrics AS (
    TQL EVAL ('2024-07-11 20:00:00Z', '2024-07-11 20:00:20Z', '5s')
      quantile_over_time(0.95, grpc_latencies{host!=""}[5s])
  ),
  logs AS (
    SELECT
      ts,
      host,
      COUNT(log_msg) RANGE '5s' AS num_errors
    FROM app_logs
    WHERE log_level = 'ERROR'
    ALIGN '5s'
  )
SELECT
  m.*,
  COALESCE(l.num_errors, 0) AS num_errors
FROM metrics AS m
LEFT JOIN logs AS l
  ON m.host = l.host
 AND m.ts = l.ts
ORDER BY
  m.ts,
  m.host;
+---------------------+---------------------------------------------------------+-------+-------------+------------+
| ts                  | prom_quantile_over_time(ts_range,latency,Float64(0.95)) | host  | method_name | num_errors |
+---------------------+---------------------------------------------------------+-------+-------------+------------+
| 2024-07-11 20:00:05 |                                                     103 | host1 | GetUser     |          0 |
| 2024-07-11 20:00:05 |                                                     113 | host2 | GetUser     |          0 |
| 2024-07-11 20:00:10 |                                      140.89999999999998 | host1 | GetUser     |         10 |
| 2024-07-11 20:00:10 |                                                   113.8 | host2 | GetUser     |          0 |
| 2024-07-11 20:00:15 |                                                    3400 | host1 | GetUser     |          4 |
| 2024-07-11 20:00:15 |                                                     114 | host2 | GetUser     |          0 |
| 2024-07-11 20:00:20 |                                                    3375 | host1 | GetUser     |          0 |
| 2024-07-11 20:00:20 |                                                     115 | host2 | GetUser     |          0 |
+---------------------+---------------------------------------------------------+-------+-------------+------------+
By using TQL commands, you can combine the power of SQL and PromQL, making correlation analysis and complex queries no longer difficult.
GreptimeDB Dashboard
GreptimeDB offers a dashboard for data exploration and management.
Explore data
Once GreptimeDB is started as mentioned in the installation section, you can access the dashboard through the HTTP endpoint http://localhost:4000/dashboard.
To add a new query, click on the + button, write your SQL command in the command text, and then click on Run All.
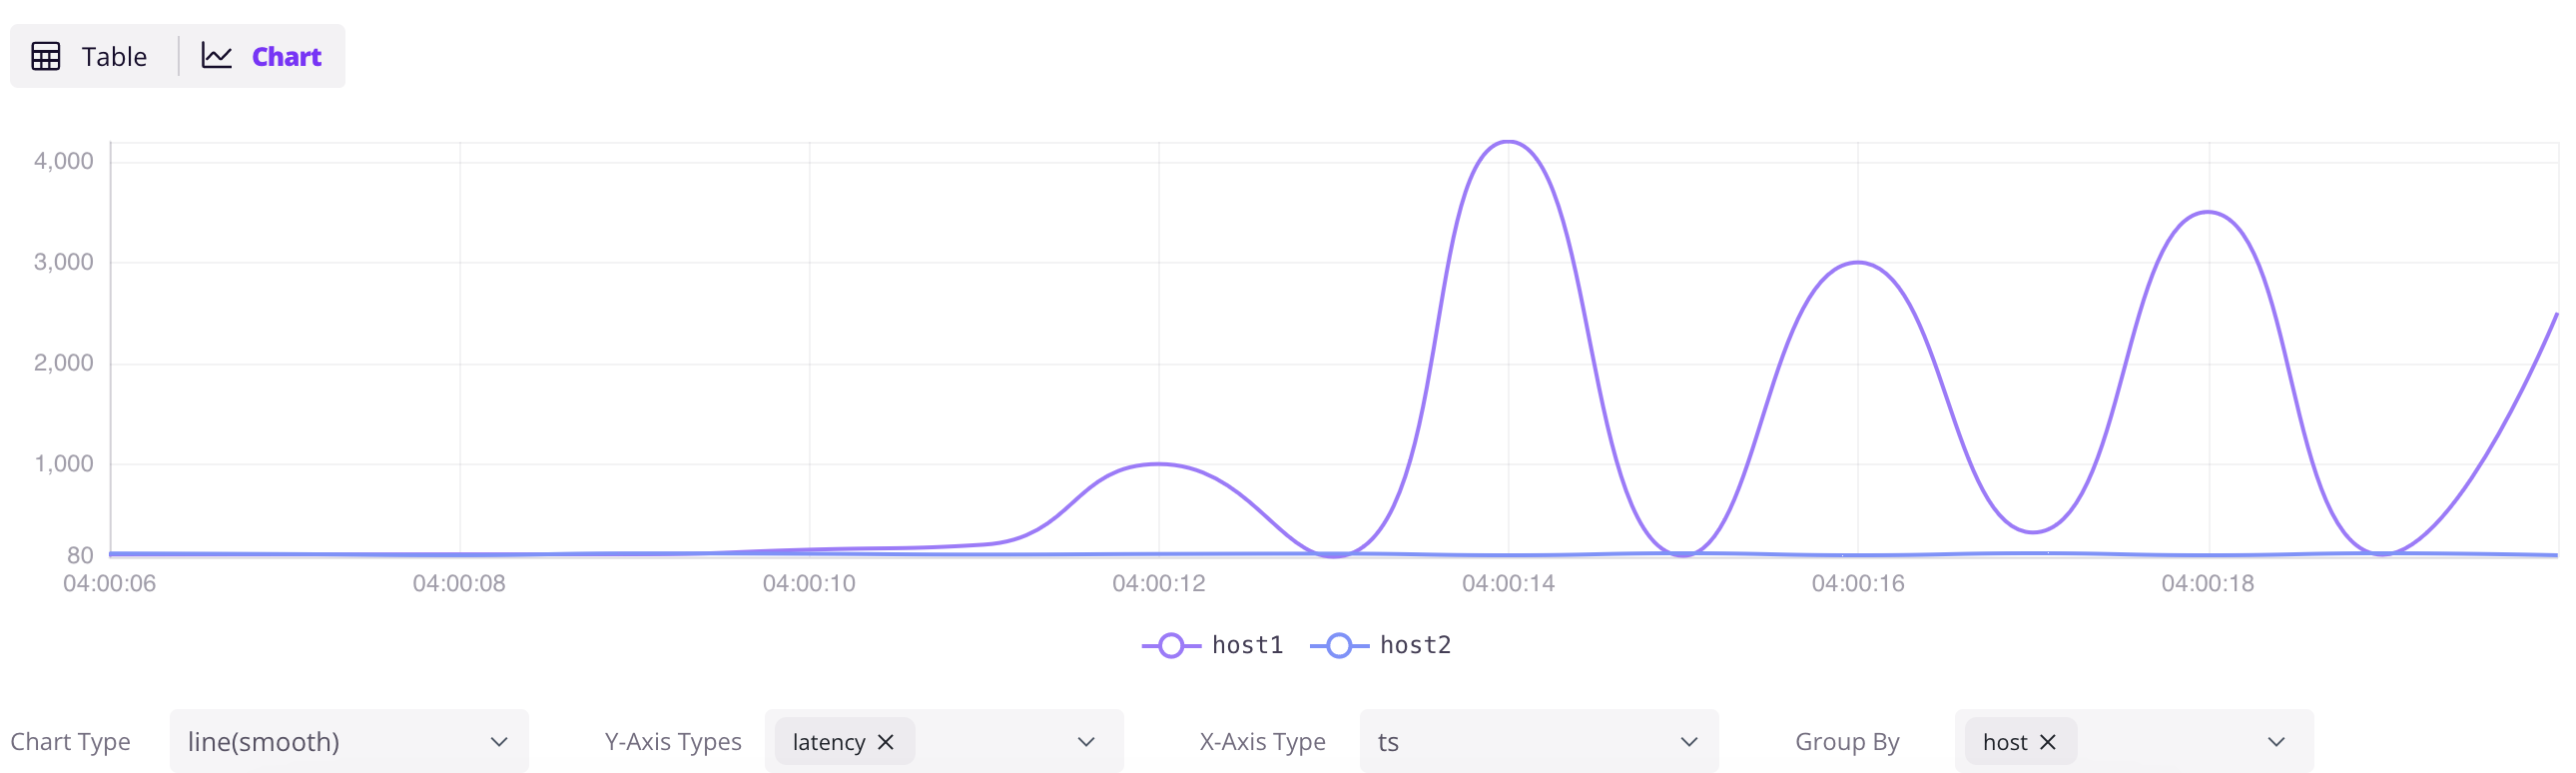
The following SQL will retrieve all the data from the grpc_latencies table.
SELECT * FROM grpc_latencies;
Then click on the Chart button in the result panel to visualize the data.
Ingest data by InfluxDB Line Protocol
Besides SQL, GreptimeDB also supports multiple protocols, one of the most popular is InfluxDB Line Protocol.
By click Ingest icon in the dashboard, you can upload data in InfluxDB Line Protocol format.
For example, paste the following data into the input box:
grpc_metrics,host=host1,method_name=GetUser latency=100,code=0 1720728021000000000
grpc_metrics,host=host2,method_name=GetUser latency=110,code=1 1720728021000000000
Then click the Write button to ingest the data to the table grpc_metrics.
The grpc_metrics table will be created automatically if it does not exist.
Next steps
You have now experienced the core features of GreptimeDB. To further explore and utilize GreptimeDB: